| Data processing, please wait... |
 |
| Data processing, please wait... |
|

5-methylcytosine (5mC) in genome are often classified in three sequence context CG, CHG, CHH and the location where the C is in. To crop the essence of genome methylation status and to meet the efficiency for performing analysis online, we introduce a straightforward method to measure the methylation landscapes regarding to the sequence contexts.
Briefly, we count the number of reads mapped to each C in a minimum threshold of 4, make an average on the methylation percentage at least five C site of each sequence context type:
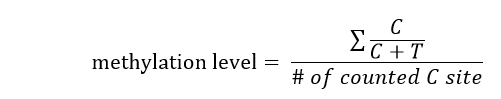
That is to say, we give six measurements (i.e., pmt-CG, pmt-CHG, pmt-CHH, gene_CG, gene_CHG, gene_CHH ) of a gene.
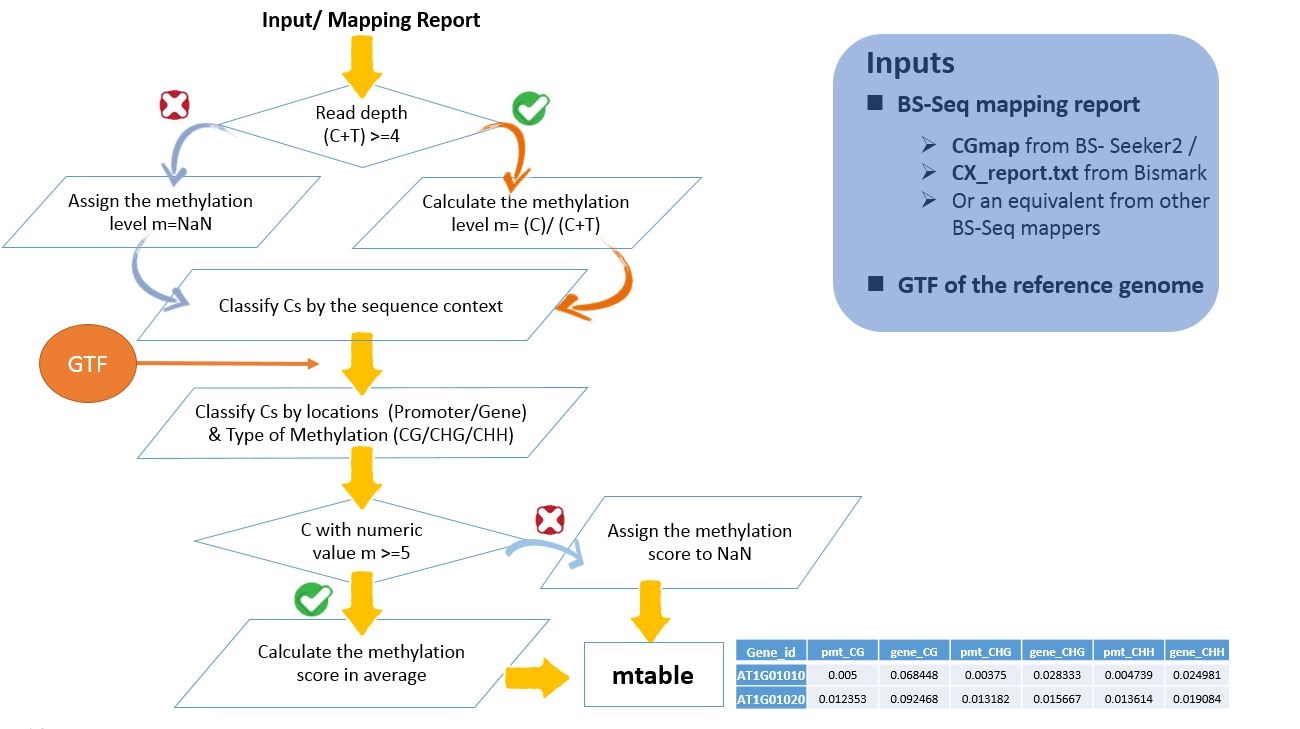
This method is implement to an in-house program EpiMolas.jar to process BS-Seq mapping results into a small, tab-delimited data file, mtable :
gene_id	pmt_CG	gene_CG	pmt_CHG	gene_CHG	pmt_CHH	gene_CHH
AT1G01010	0.011463	0.053009	0.010000	0.011635	0.021765	0.012631
AT1G01020	0.000000	0.081519	0.006957	0.007177	0.003614	0.007521
AT1G01030	0.005385	0.012800	0.002439	0.023452	0.003116	0.016939
AT1G01040	0.011200	0.589821	0.009677	0.015773	0.016944	0.011699
AT1G01046	0.765250	0.385000	0.022500	0.058750	0.014325	0.047727
........
Note The align of column name and value is not changed to make perfect view on webpage, but they do seperated to the neighbors by tab. You can find seven column names in the first row, and the six data columns, lead by the gene id column.
These measurements are a normalized score from 0 (all observed sites are unmethylated) to 1 (all observed sites are methylated), or "NaN" for genes which do not have sufficient reads/sites to calculate the value. A deviation of 0.1 on the measurement reflects 10% of Cs on the observation change the methylation state.
Check The Java Environment
Before you run the EpiMolas.jr, please check the java environment installed properly in your linux environment. For example, simply type a version check :
java -version
and you will get a return like:
  openjdk version "1.8.0_45-internal"
  OpenJDK Runtime Environment (build 1.8.0_45-internal-b14)
  OpenJDK 64-Bit Server VM (build 25.45-b02, mixed mode)
If not, you need to ask the administrator's help for installing Java.
Download the EpiMolas.jar from github (move to the directory that you want to save the script):
wget https://github.com/markchiang/EPI-MOLAS/releases/download/0.3/EpiMolas.jar
Converting the report to mtable:
First, we assume that you have completed the mapping process and had the right mapping report, *.CGmap from BS-Seeker2, or CXreport.txt from Bismark
The Usage:
java -jar EpiMolas.jar the_input_mapping_report_file gtf > the_output_file
mtable from BS-Seeker2 CGmap output file (e.g., the input file: my.CGmap and the output mtable file: result.mtable
java -jar path_to/EpiMolas.jar path_to/my.CGmap path_to/TAIR10.gtf > result.mtable &
mtable from Bismark CX_report output file (e.g., the input file: my.CX_report.txt and the output mtable file: result.mtable &
java -jar path_to/EpiMolas.jar path_to/my.CX_report.txt & path_to/TAIR10.gtf > result.mtable &
You need to indicate paths to the required files (EpiMolas.jar, the input mapping report file, gtf) if they are not in the same directory where you execute EpiMolas.jar.
You may specify -Xmx on the maximum RAM memory in use and -Xms on the initial
memory. Emprically, if you have a *.CGmap file in size of X Gb, you may assign 2.3*X GB in the -Xms to
ensure the success of run.
It will look like $java -Xms10G -jar EpiMolas.jar exp1.CGmap TAIR10.gtf > exp1.mtable & if 10G
RAM is allocated as the initial memory of run.
| Lastest update 2016/07/15 |