| Data processing, please wait... |
 |
| Data processing, please wait... |
|

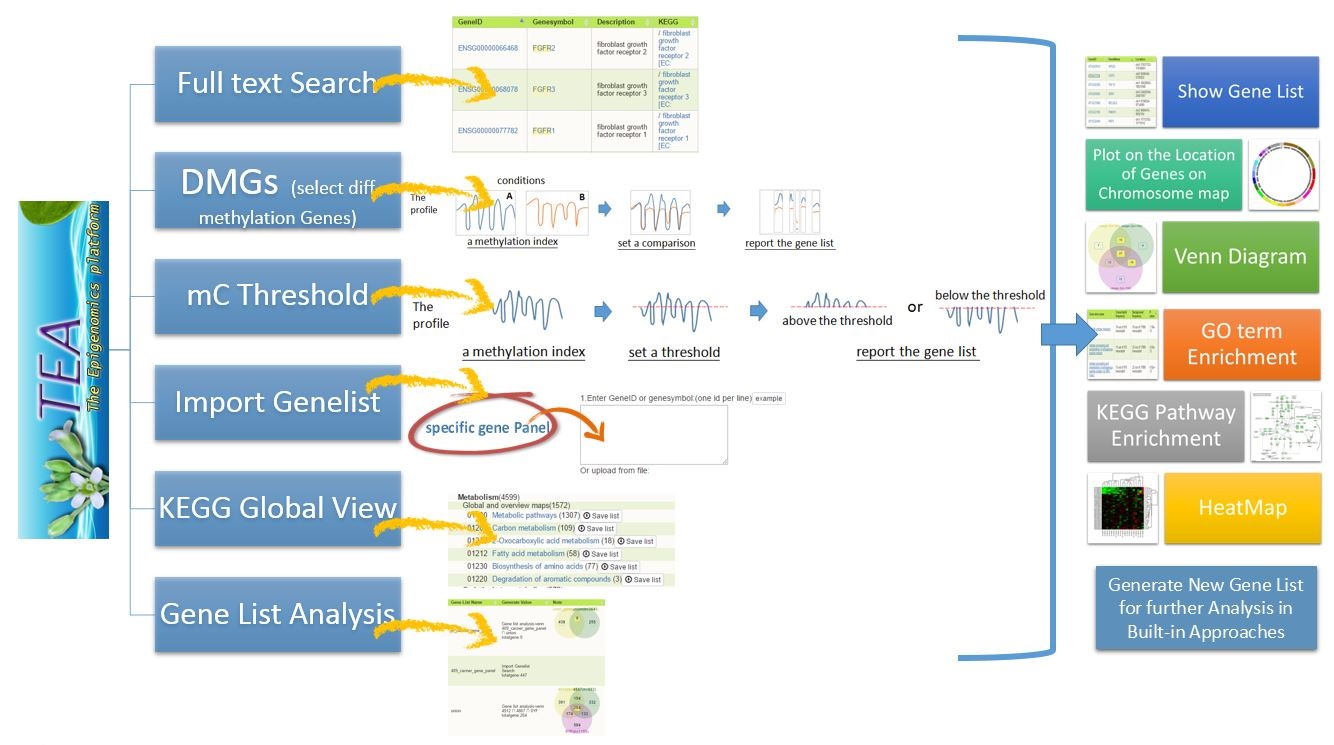
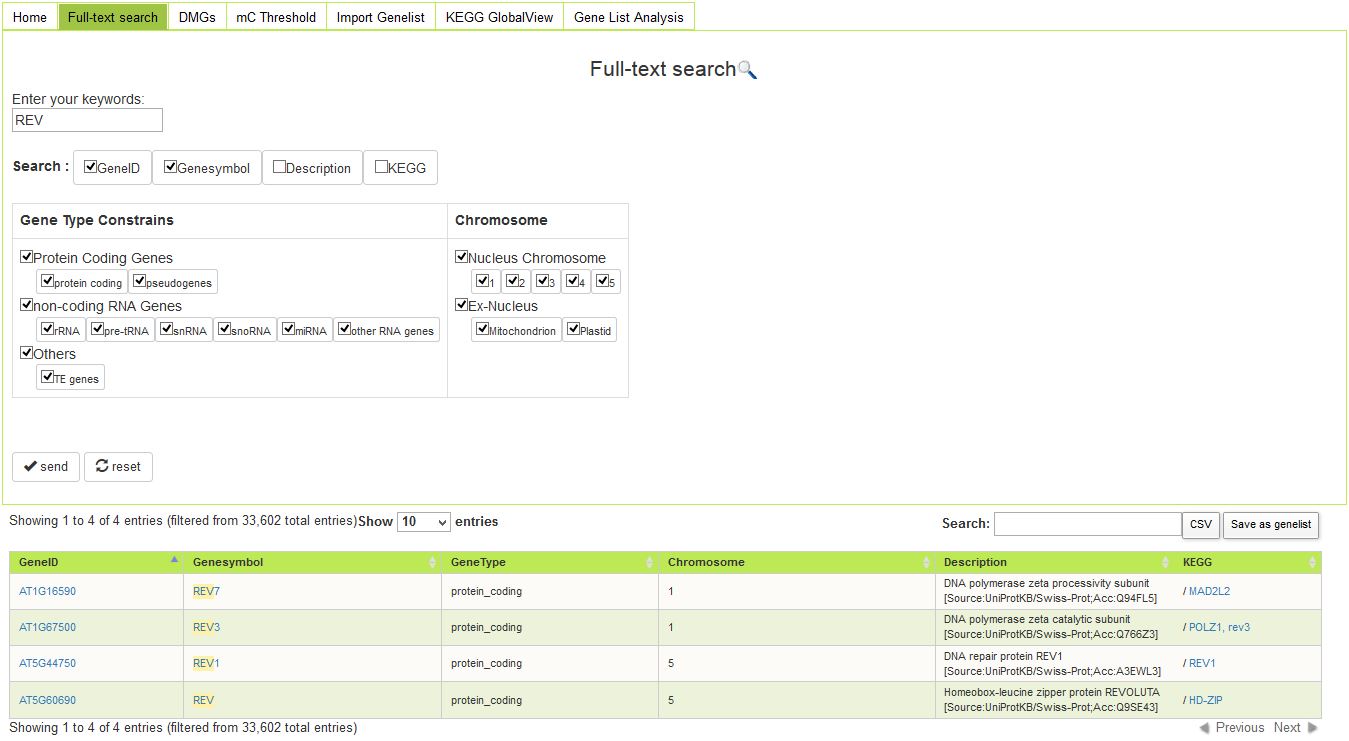
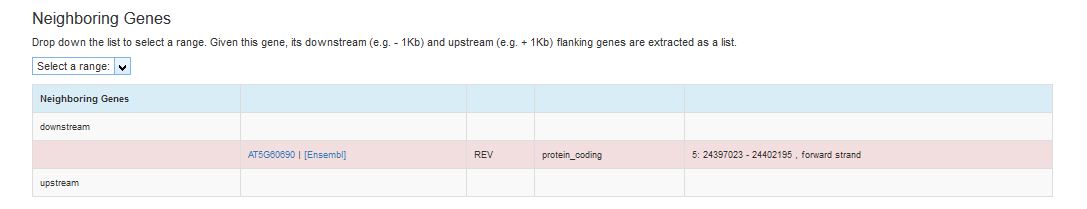
Search the interested genes in the keyword search from the context of gene ID, gene symbol, gene description, and KEGG description. For example, REVOLUTA (REV) is one of the Arabidopsis Class III homeodomain-leucine zipper (HD-Zip III) proteins and is involved in Arabidopsis flowering. Just type 'REV' to see what comes out.
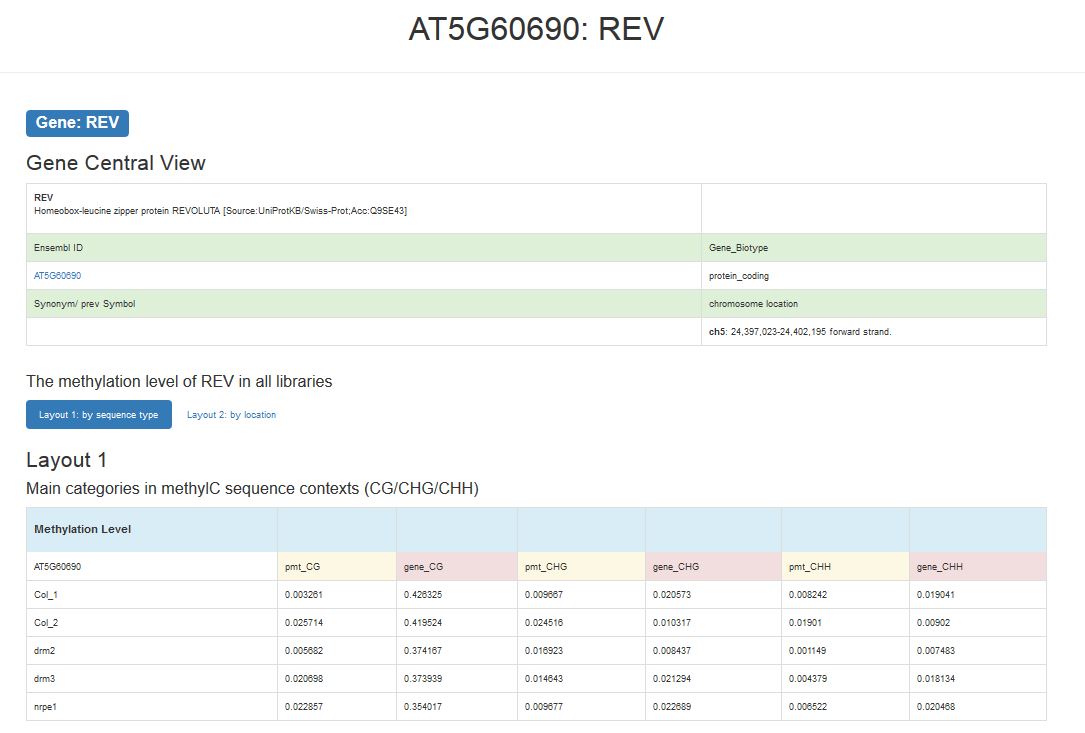
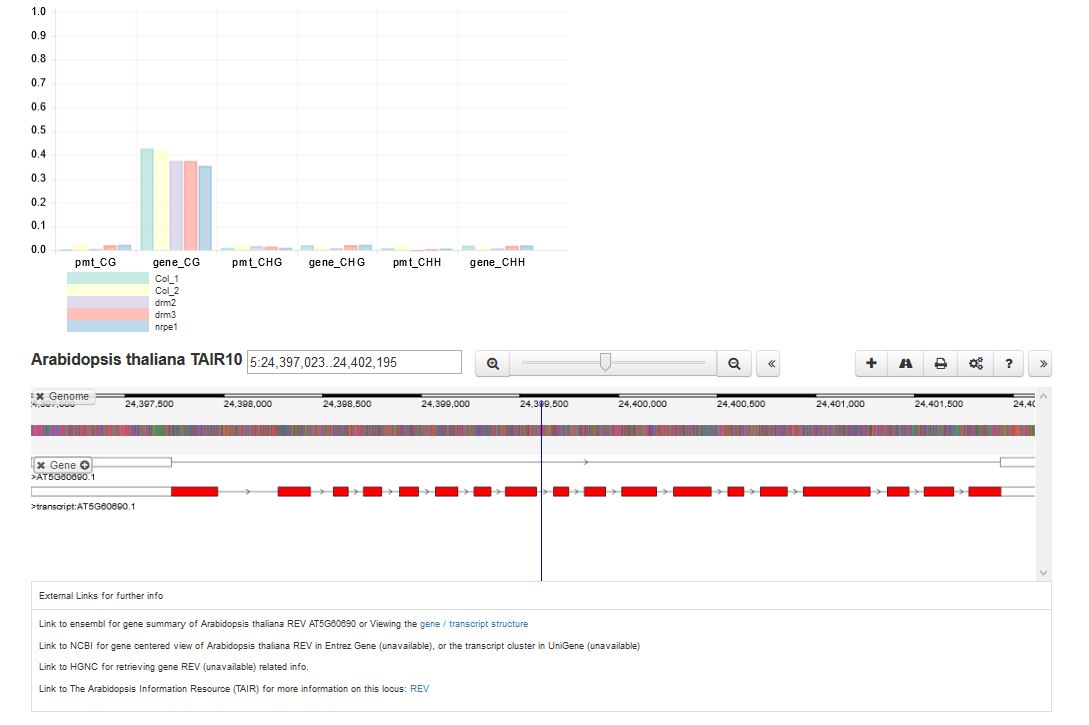
Click on the gene, you can see its gene annotation including Ensembl ID, biotype, chromosome location. Two types of layout are provided to show the methylation level of this gene in all libraries. Biodalliance genome browser is embedded to help users investigate the flanking upstream/downstream regions and intron-exon structure of the gene. The alternative way is to select a range (1 Kb ~ 5 Mb) to show its neighboring genes.
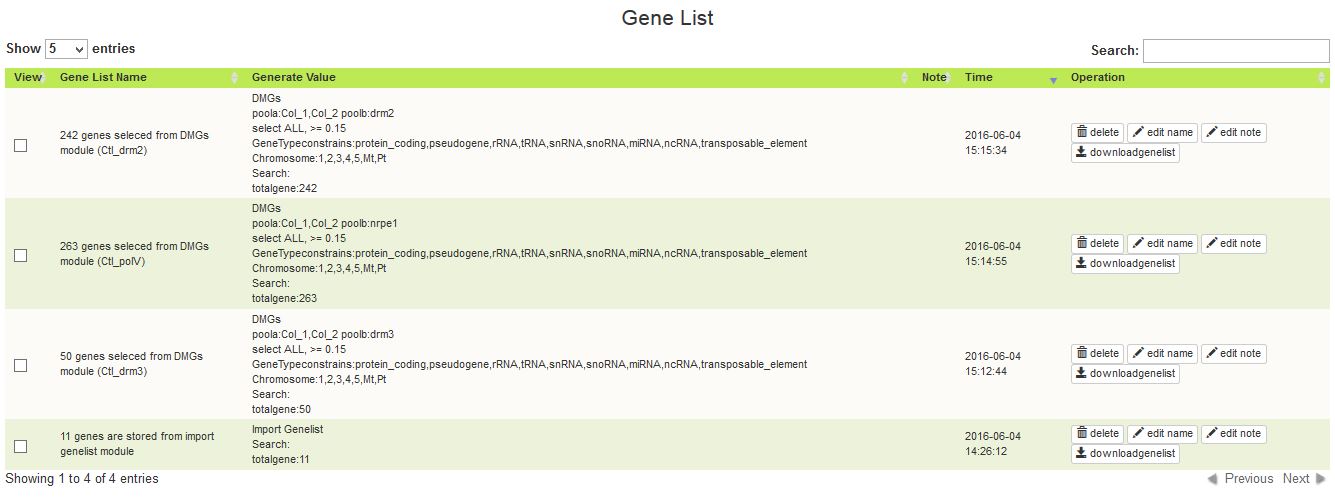
Module DMGs (Differentially Methylated Genes) is a pairwise comparison workflow for two data pools (experiment conditions). Select datasets you want to compare and analyze. If two or more datasets are selected in one pool, the mean values are taken as the methylation level of this pool.
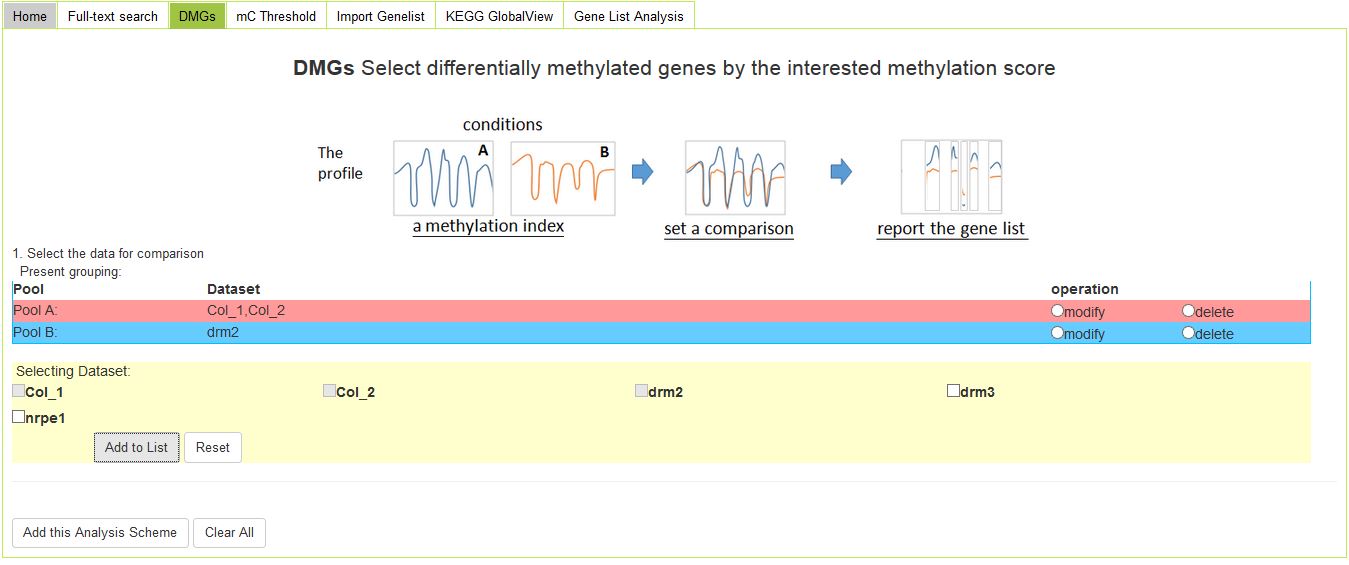
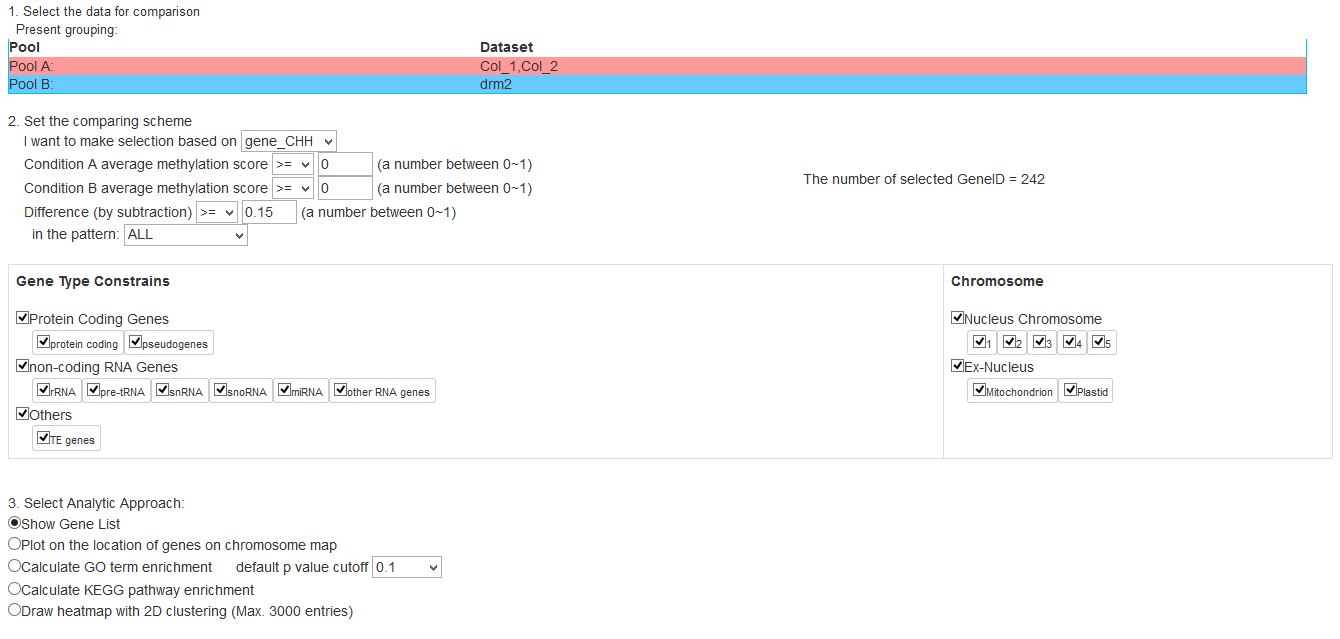
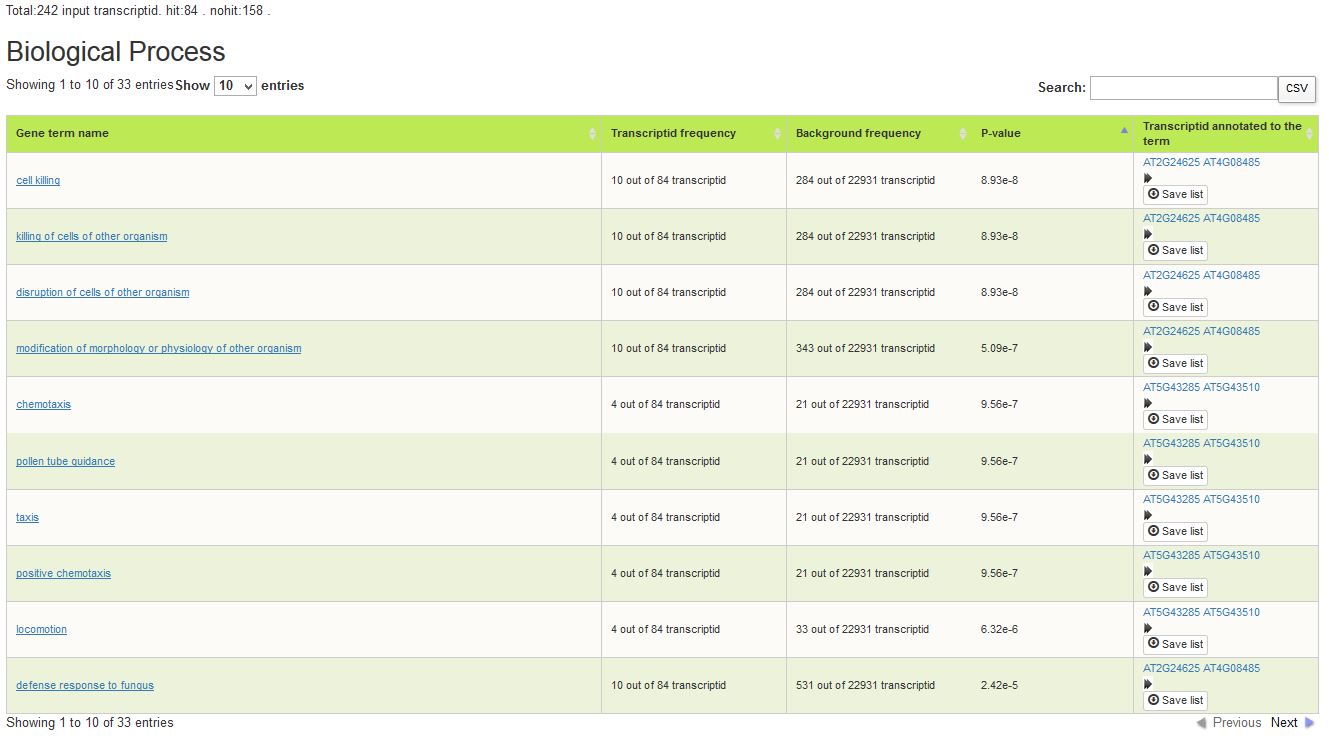
Col_1 and Col_2 are wild type datasets as control group in Pool A. Pool B is dataset of drm2 gene silencing mutant. 242 genes are selected on a criterion of gene body CHH methylation with difference at least 0.15.
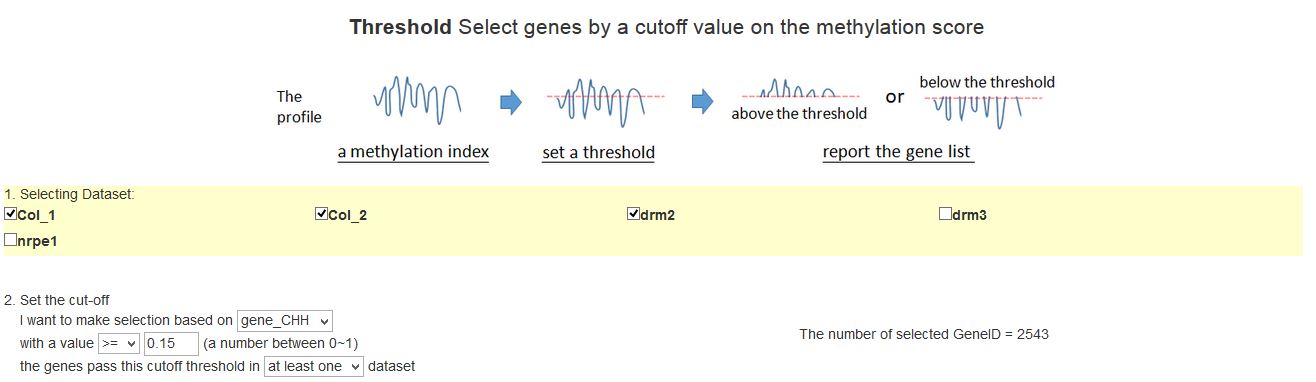
Module mC Threshold is used for selecting genes above or below a cutoff in at least one or among all the selected datasets.
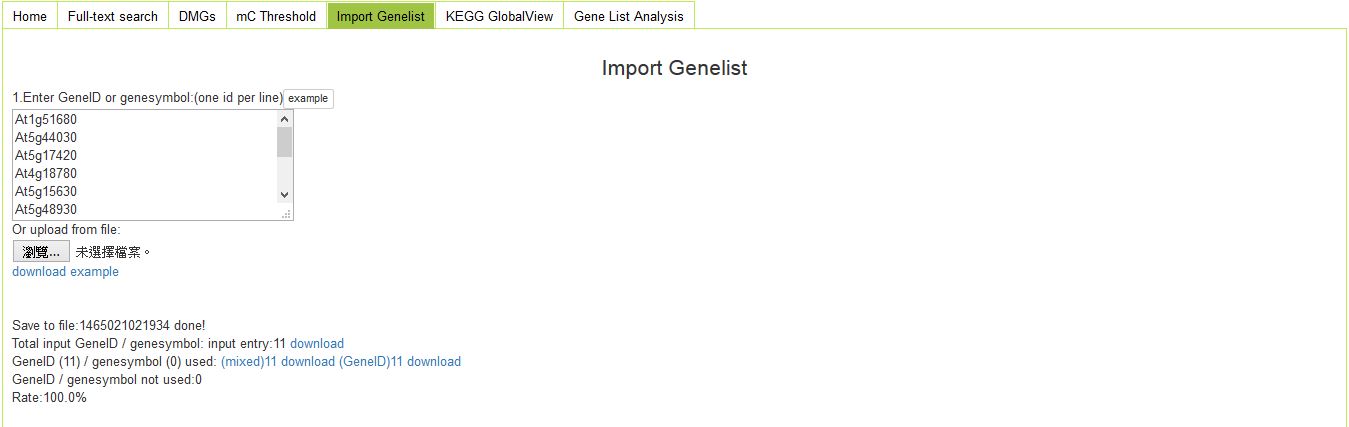
In Import Genelist module, users can paste or upload a file of a list in gene ID or gene symbol. Here, we directly paste 11 gene IDs, and these identifiers are all matched to the database.
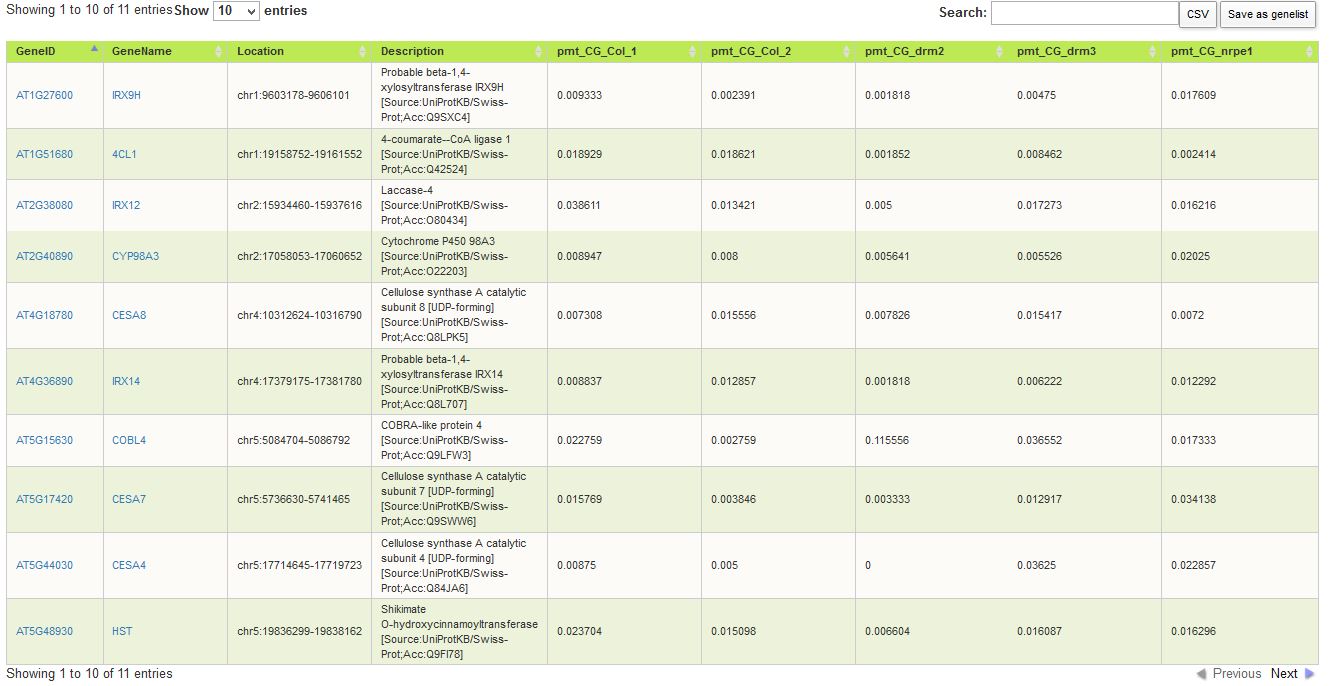
Select "Show Gene List" and click on "Send". These genes are shown in a table.
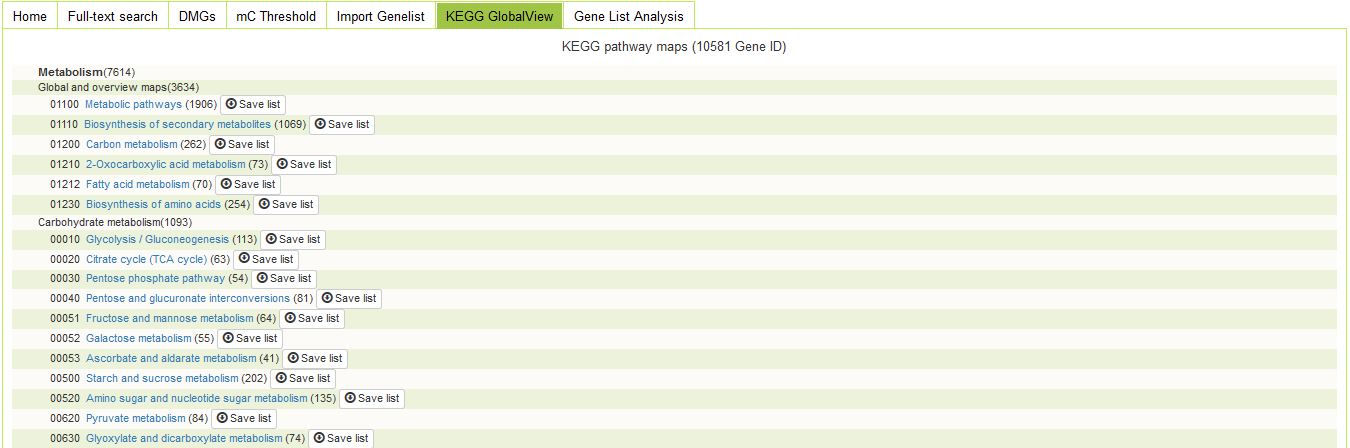
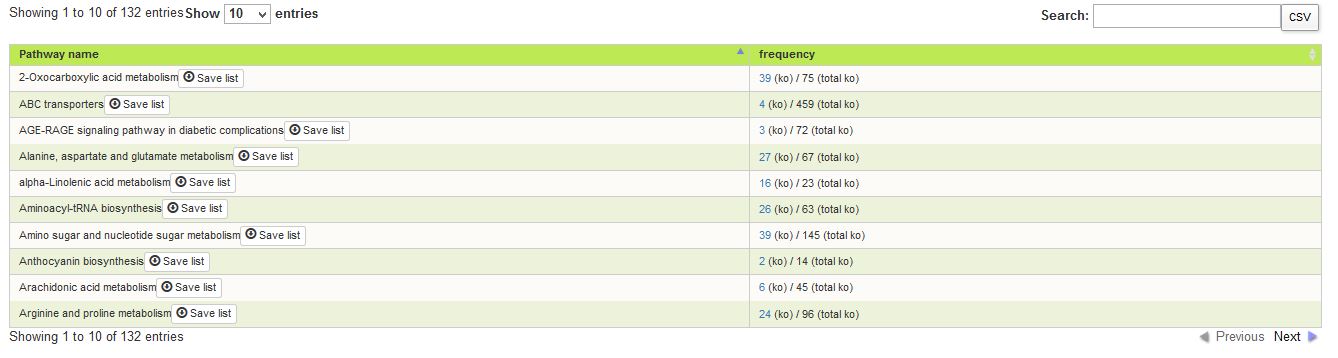
KEGG Global View module provides an overview picture of KEGG pathway of Arabidopsis thaliana. You can investigate specific metabolic pathway by exploring each category.
DMGs selected in the control group and each of the three gene silencing mutants (drm2, drm3, nrpe1) on the criterion mentioned (gene_CHH, difference >= 0.15 ) are saved as three gene lists. Select the three gene lists and choose "Venn Diagram" analytic approach. The figure shown below is the same as the one in the literature
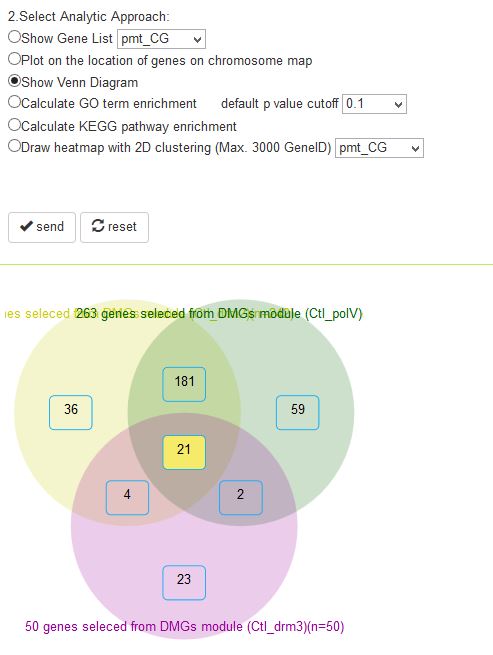
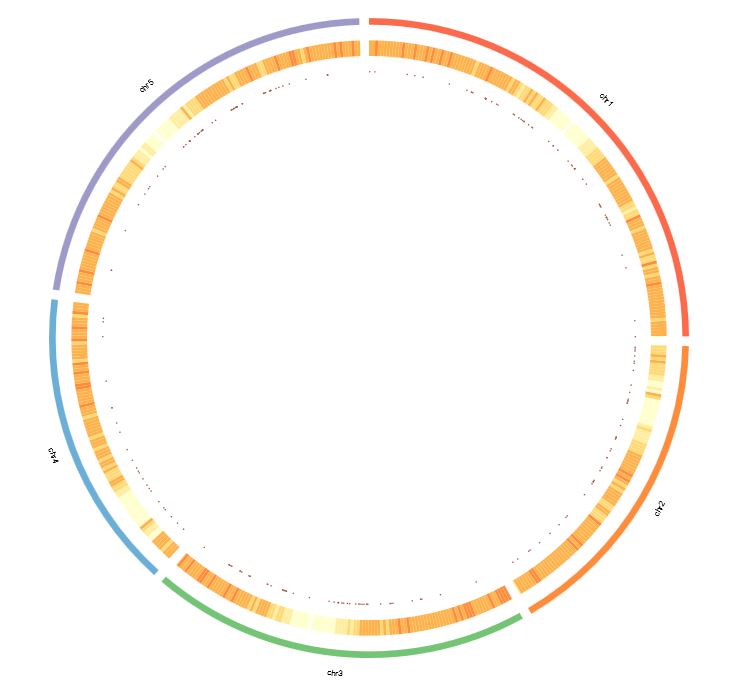
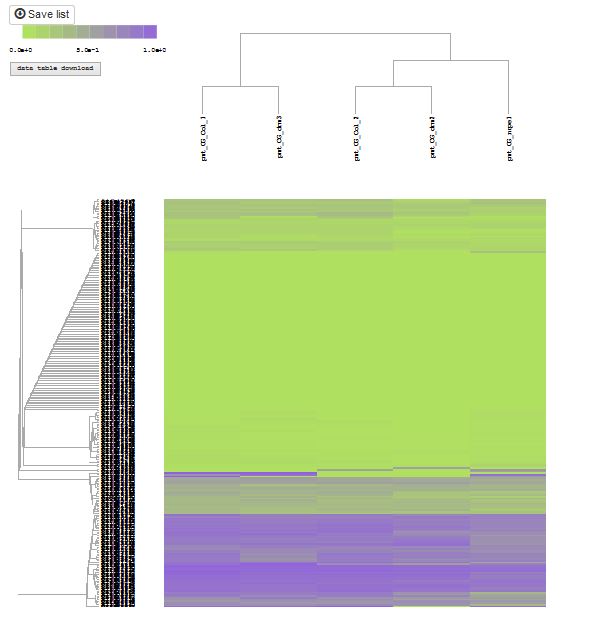
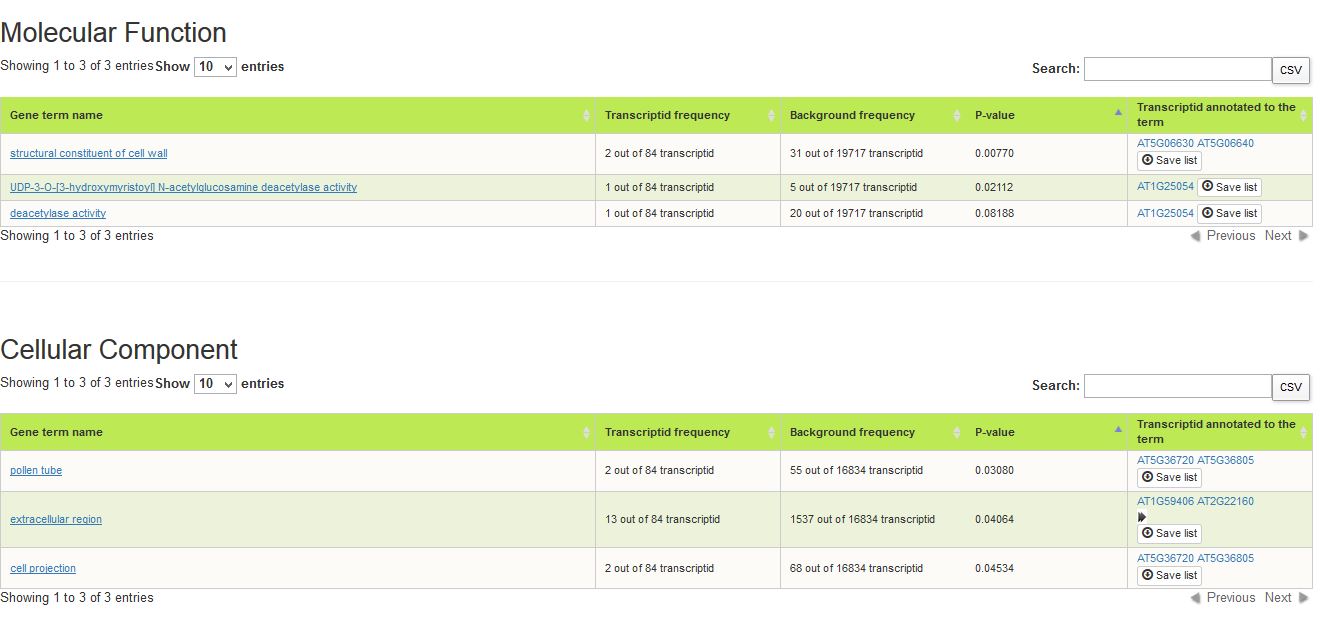
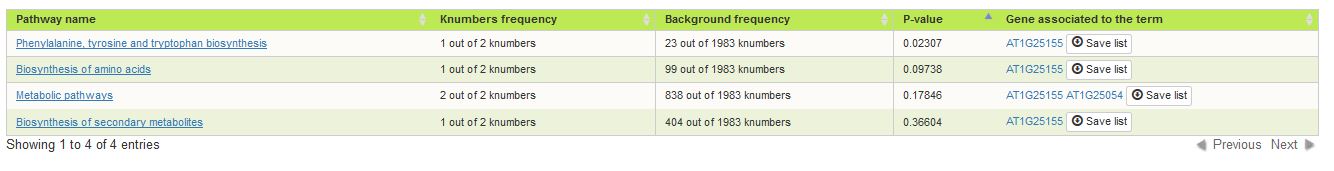
Other analytic approaches include "Plot the location of genes on chromosome map", "Heatmap with 2D clustering", "Calculate GO term enrichment" and "Calculate KEGG pathway enrichment".
| Lastest update 2016/07/15 |